Process mapping for agentic AI: a step-by-step guide
Nine steps to map one workflow for agentic AI: choose it, map it from real records, measure it, check readiness, redesign it and set a go/no-go KPI.

Executive summary #
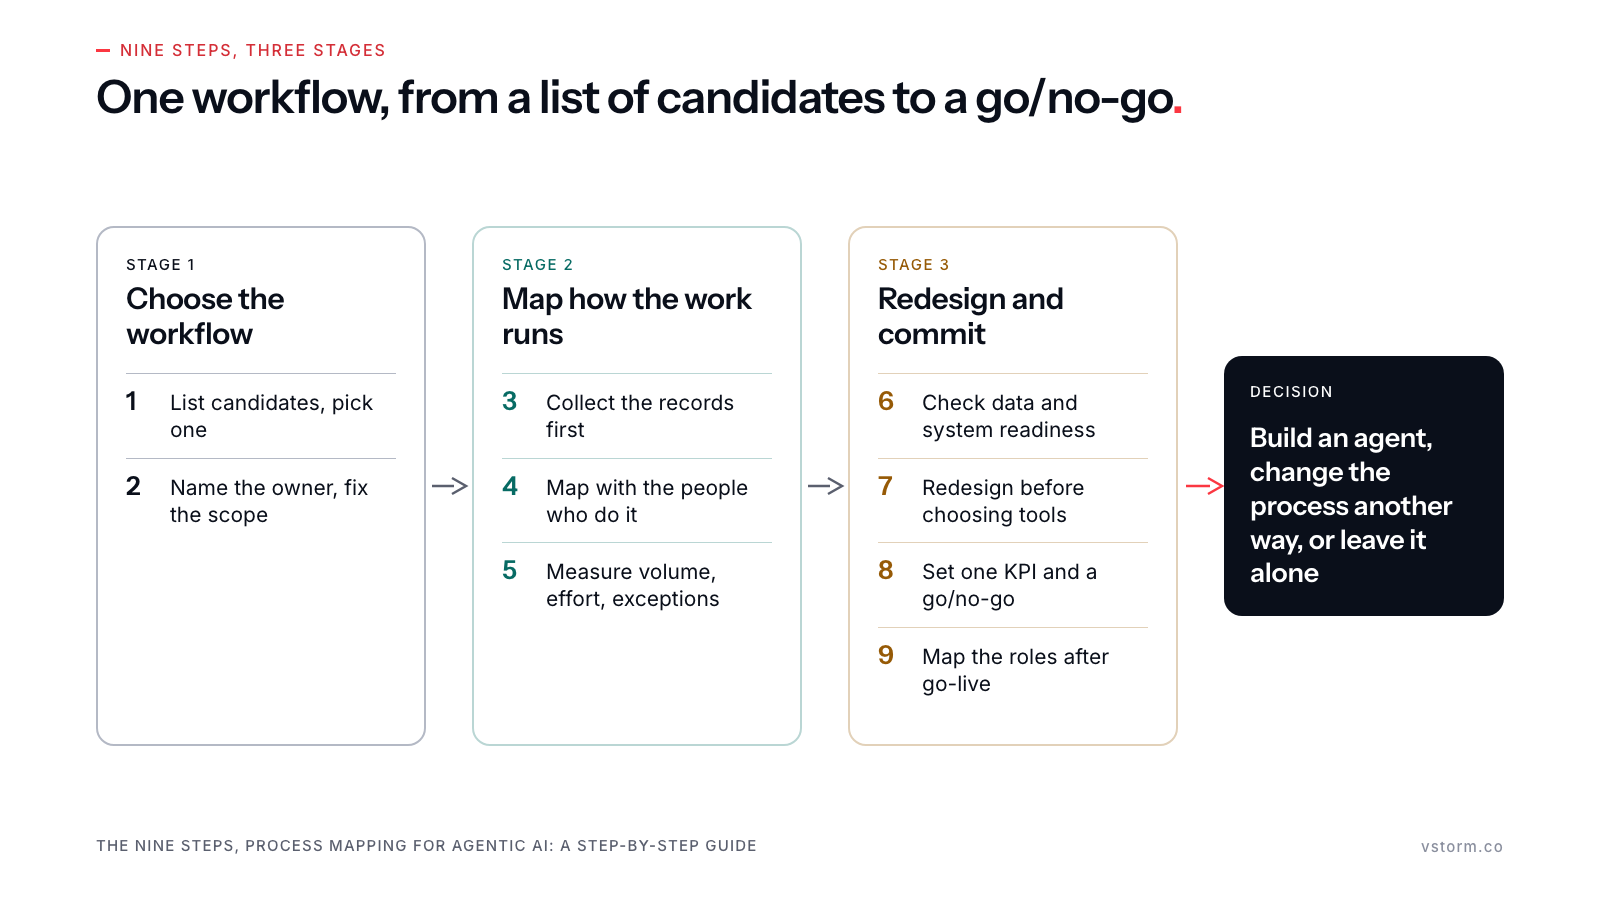
Most process maps describe how work runs today and stop there, so an agent built on them inherits every handoff and queue. This guide treats process mapping for AI as the design input for a build, in nine steps and three stages. Stage 1 picks one workflow and names its owner. Stage 2 maps it from the records the work already leaves, then with the people who do it, and puts numbers on volume, effort and exceptions. Stage 3 checks readiness, decides step by step between an agent, a rule-based model, plain automation and a person, and fixes one go/no-go metric before the build. The examples come from recent Vstorm projects, including 5,483 emails sorted into 25 request types and a classic model that beat an LLM on invoice classification (macro-F1 0.93 against 0.63), so the guide stays practical and grounded in our own work.
The process maps clients bring to our first meeting usually show the steps of a workflow. They rarely show how often each path occurs, which exceptions take the most time, where the data lives, or who owns the outcome. An agentic AI build needs all four.
Process mapping for AI is the work of answering those questions for one workflow. It starts from the records the work already leaves behind, adds what only the people doing the work know, and ends with a decision: build an agent, change the process another way, or leave it alone.
This guide sets out the business process mapping steps we use at Vstorm: nine steps in three stages. The steps apply to a company of any size, because the scope is always one workflow.
This guide opens a series on where agentic AI adoption gets stuck #
In our projects, agentic AI adoption meets friction at three points. The first comes before anything is built, when the people who know the process have no time to describe it. The second comes during the build, when the systems and data are not ready. The third comes after it, when a working system has to be accepted by the team it was built for.
Process mapping runs through all three, which is why we publish this guide first. Three articles will follow on the Vstorm blog, each taking one point of friction in depth through the project it came from:
- How a mailbox export replaced weeks of expert interviews.
- What a time-boxed build on partial data showed an automotive dealership group.
- How roles shift once an AI system goes live.
Where a step below draws on one of those projects, we will add a link to the full story as each article goes live.
What a process map needs to show before an AI build #
Most process improvement projects start with a mapping workshop. The team members involved list the steps on sticky notes or a whiteboard, and someone turns them into a swimlane diagram, with one lane per role. Teams that need precision use BPMN (Business Process Model and Notation), a standard set of process mapping symbols published as the international standard ISO/IEC 19510:2013, identical to OMG BPMN 2.0.1. These maps show well who does what, and in which order.
An agent needs more than that. Before we build, the map has to show, for each step, how many cases take each path and which exceptions occur. It also has to show where the data comes from, whether a system lets software read it or act on it, who makes the decision, and what a good result looks like in numbers.
No single type of process map covers all of it. The table compares the methods we combine.
| Method | What it shows | What you need | Best used when |
|---|---|---|---|
| SIPOC | Scope on one page: suppliers, inputs, process, outputs, customers | A short session with people who know the process | You need to agree where the process starts and ends |
| Swimlane diagram or BPMN | Steps, handoffs and decisions by role | Workshops or interviews with the people who do the work | You need a shared picture of who does what |
| Value stream map | Flow, waiting time and waste from request to delivery | Observation of the work and timing data | Delays and rework are the main problem |
| Process mining | The real sequence of steps across thousands of cases | Structured event logs from systems such as an ERP | The process runs inside systems that log every step |
| AI analysis of records | Request types, volumes and effort hidden in emails, tickets and documents | An export of the records and a data processing agreement | The process runs through email or free text with no event log |
Sources for the table: SIPOC as described in the AHRQ workflow toolkit, value stream mapping as defined by the Lean Enterprise Institute, and process mining as defined by Wil van der Aalst.
We rarely use one method alone. A SIPOC sets the boundaries, an analysis of records shows the volumes and request types, and a swimlane drawn with the team captures the handoffs and exceptions. The nine steps below put them in order, and none of them needs specialist process mapping tools: a whiteboard, a diagramming app and a spreadsheet are enough.
Stage 1: choose the workflow #
Step 1: list candidate workflows and pick one
Mapping the whole company at once produces a large diagram and no decision. Start with a list instead.
In a 60 to 90 minute session with department heads, collect every workflow where people repeat rule-based work, wait for information before deciding, answer predictable customer requests, or search for knowledge that sits with a few colleagues. Add the places where problems are caught too late. Send these prompts 48 hours before the session, so people arrive with examples from their own week.
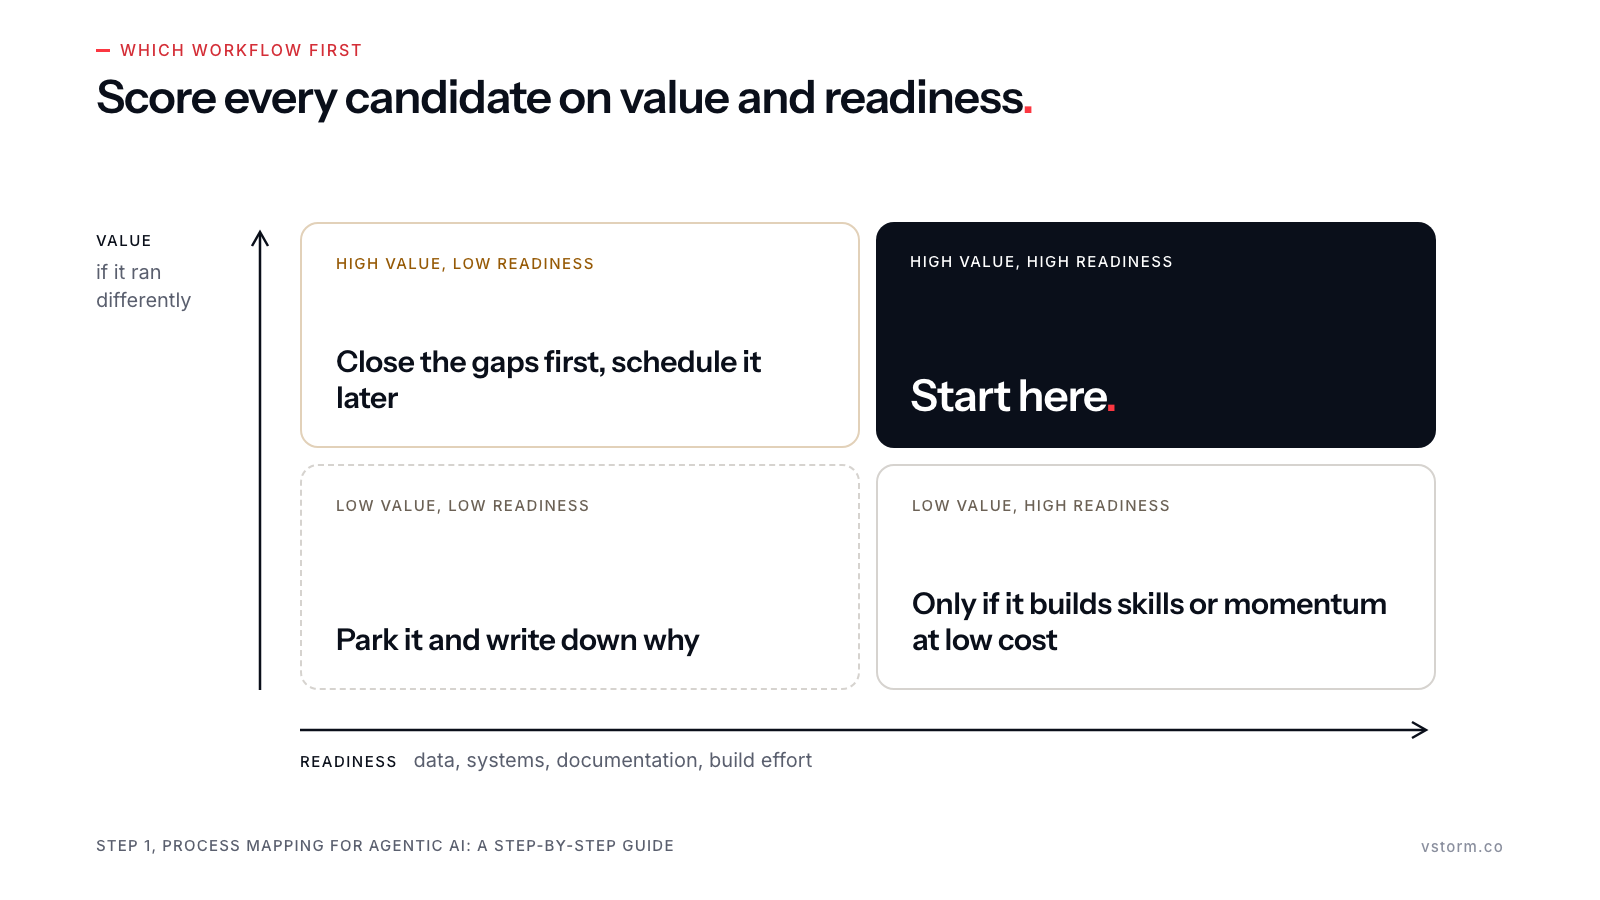
Then score each workflow on two questions. How much value would it create if it ran differently? How ready is the company to change it, judged on data, systems, documentation and the effort a build would take? The answers place each workflow in one of four groups:
- High value and high readiness: start here.
- High value and low readiness: worth doing, but close the gaps first and schedule it later.
- Low value and high readiness: do it only if it builds skills or momentum at low cost.
- Low value and low readiness: park it, and write down why, so the people who proposed it can see the reasoning.
Pick one workflow from the first group. A company learns more from one workflow that is mapped, built and measured than from a dozen mapped and left on a shared drive.
Step 2: name the owner and fix the scope
Before anyone draws a box, name the person who owns the business result of the workflow: the head of accounts payable for invoice handling, or the customer service lead for inbound requests. That person signs off the scope now and the success threshold later. The IT team and the project managers can run the project, but the business owner has to own it.
We learned this at cost. For an automotive dealership and service group in Central Europe, we built a system that matches cost invoices to contracts. It has run on the production servers since September 2026, yet the accounting workflow does not call it. The manager responsible for that area was not involved in the project, and nobody agreed who should trigger the system.
Fix the scope on one page. SIPOC diagrams suit this: they list the suppliers who provide inputs, the inputs themselves, a handful of high-level steps, the outputs, and the customers who receive them, and they force agreement on the start and end points of the workflow. If the page needs more than a handful of steps, the scope is too wide for a first workflow.
Stage 2: map how the work really runs #
Step 3: collect the record before the interviews
Before you create a process map, collect what the work already records. Most workflows leave a trail: emails in a shared mailbox, tickets in a help desk, entries in an ERP. When a system logs every step as a structured event, process mining can rebuild the real sequence of work from those logs (van der Aalst).
Work that runs through email has no such log. Language models can create one from the text: they group similar requests, count them and measure how long each kind takes to answer.
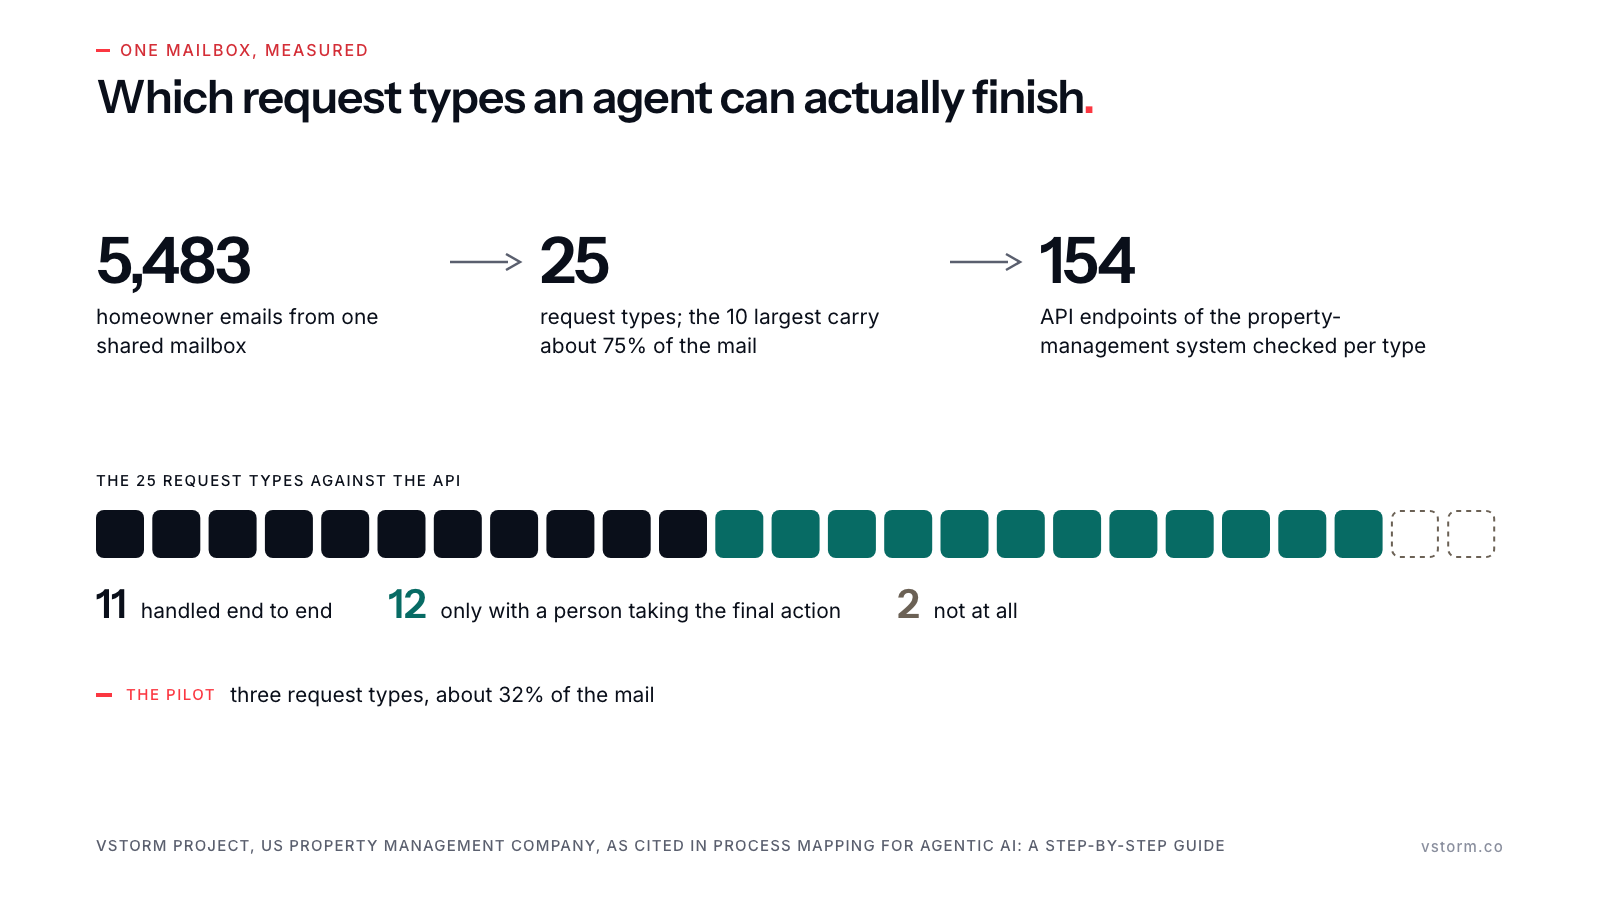
For a US property management company, we analyzed 5,483 homeowner emails from one shared mailbox. We used sentence embeddings, which turn each email into numbers so that similar requests sit close together, and a clustering method that groups them. The emails fell into 25 request types, and the 10 largest carried about 75% of all mail. Nobody had to describe the inbox from memory.
Customer emails contain personal data. Sign a data processing agreement before any export, take only the mailbox and the period you need, and run the analysis where the data is allowed to sit. When data must not leave the company, the models can run on infrastructure the company controls, as we describe in our article on small language models in the middle market.
Step 4: map the current state with the people who do the work
Now bring in the experts, with the analysis on the table. Their job changes from describing everything from memory to checking what the records show and adding what records cannot hold: why a case gets escalated, which customers receive special treatment, which rule everyone works around. The result is a current state process map that is both measured and confirmed by the people who run the process.
Draw it as a detailed process map: a swimlane, one lane per role, and mark every handoff, every wait and every decision point. Map the exceptions as carefully as the main path, because in agentic projects the exceptions decide how much of the work an agent can take on.
In a traditional IT project, you can usually work from a specification. In an agentic project, the specification lives in the heads of two or three people, and it is unstructured. — Wojciech Achtelik PhD(c), AI Engineer Lead, Vstorm
Those two or three people are the scarcest resource in this stage. Book their hours in the plan before mapping starts; we explain why in Lesson 1: Your experts' time is the ultimate AI bottleneck.
Step 5: measure volume, effort and exceptions per step
Put numbers on every path in the map: how many cases a week, how long each takes, how often it fails or comes back, and how often it is escalated. Identifying bottlenecks starts here: the step where cases wait longest or come back most often usually holds the business case. These numbers build the business case, and later they become the baseline you measure the new system against.
At a US furniture retailer, six auditors checked about 700 of roughly 2,700 delivery orders a day, about 26%, largely from memory. That one figure made the case better than any diagram, because nearly three in four orders were never checked. The system we delivered with a partner now scores every order against 34 rules and sends auditors only the orders it flags.
Stage 3: redesign and commit #
Step 6: check data and system readiness for each step
For every step an agent might touch, rate three things green, amber or red: data, systems and process documentation.
| Dimension | Green | Amber | Red |
|---|---|---|---|
| Data | Exists, is accessible and is structured enough to use | Exists but needs cleaning or consolidation | Missing, siloed or inaccessible |
| Systems | API access to the systems involved and security policies in place | Integrations or policy changes needed first | Legacy systems with no API access |
| Process documentation | Documented and done the same way across teams | Understood but undocumented, or done differently by different teams | Varies from person to person and is not standardized |
Then test the systems directly. For the property manager, we checked each of the 25 request types against the 154 endpoints of the API of its property-management system. Of those types, 11 could be handled end to end, 12 only with a person taking the final action, and 2 not at all. That check chose the pilot: three request types that together make up about 32% of the mail.
A red rating does not cancel a workflow. It moves the workflow later in the plan and adds a task to close the gap. The risk of ignoring it is real: Gartner predicts that through 2026 organizations will abandon 60% of AI projects that lack AI-ready data (Gartner, February 2025). When nobody can say whether the data is good enough, build a small, time-boxed test on the data that exists and let the result decide.
Step 7: redesign the workflow before choosing tools
A current state map shows work organized around human limits: handoffs between departments, approval queues, batches processed once a week. An agent placed on top of that map inherits all of them. Redesign first, then decide, step by step, what should do the work.
| Option | Use it when | Example from our projects |
|---|---|---|
| An agent | The step needs judgment over unstructured input and draws on several systems | Drafting replies to homeowner emails with balances and statements pulled from the property-management system (pilot in build) |
| Rules or classic machine learning | The decision follows stable patterns and enough labeled history exists | Sorting cost invoices by workflow type: a random forest model scored macro-F1 0.93 against 0.63 for an LLM |
| Plain automation | The step is fixed and repeats without judgment | Building and emailing invoice packages to each client of a home-services marketplace, with no AI involved |
| A person | An error is costly, or the case is rare and sensitive | Legal, hardship and collections emails at the property manager go straight to staff |
We tested both approaches on the invoice sorting before choosing. Macro-F1 is an accuracy score that weighs every invoice category equally, so a model cannot score well by getting only the common categories right. The classic model, trained on features from the client's own rules, won. It runs in production, and the language model's answer appears beside it only as a second opinion. Some steps need no AI at all, and the map should say so.
On the target map, mark where a person approves, which cases escalate and to whom, and which actions the system may never take on its own. At the property manager, no email leaves without staff approval.
Step 8: set one KPI and a go/no-go threshold
Agree on one number that decides whether the build continues, and agree on it before the build starts. Choose a metric the owner already cares about and can check, such as the share of drafts used, the cases handled without escalation, or the time per case. Add the quality gates that protect it.
For the property manager's pilot, the targets are at least 70% of drafted replies used as written or with light edits, at least 90% accuracy in recognizing the request type, and no more than 15% of drafts rejected, measured over four weeks after launch. The pilot is still in build, so these are the targets it will be judged on.
If the system misses the number, the build stops. That rule protects the budget and the credibility of the next workflow.
Step 9: map the roles after go-live
The last map shows people. Who reviews what the system produces? Who handles the cases it escalates? Who watches the metric, and whose daily work changes? In our projects, the people who stay usually move from doing the work to supervising it. The auditors at the furniture retailer now review the orders the system flags instead of checking over a quarter of the day's orders from memory.
Plan the training and the change program now, with the owner named in Step 2.
Mistakes that turn a process map into shelfware #
Process mapping has real value because it lets you focus. But even a diligent map will not make an AI project efficient on its own, because AI is application and discovery at the same time. — Bartosz Gonczarek, Co-founder and Chief Transformation Officer, Vstorm
The steps above prevent the common failures. Four less obvious ones are worth naming.
- Treating the map as finished. Once a system runs, it produces data the first map could not have: real volumes, new edge cases, the cases people overrule. Update the map from that data before you choose the next workflow. A map kept current this way becomes the basis for continuous improvement across workflows.
- Letting the most senior voice score the candidates. In Step 1, a quick low score from the CEO can end a strong idea before anyone has looked at it. Score first, discuss after.
- Confusing frequency with value. The largest request type is not always the best target. Rare cases, such as legal disputes or hardship requests, can carry more risk and cost than their count suggests.
- Mapping with managers only. Managers describe the process as designed. The people who do the work describe it as it runs, and the exceptions live in that difference.
When a full process map is more than you need #
We build custom agentic systems, so we lean toward mapping as the first step of a build. It is not always worth the effort. A short, rule-based task that is already documented needs one of the standard process mapping templates, such as a SIPOC, and a script or a rules engine, and a nine-step map would cost more than the work it describes.
A workflow that leaves no written trace, because it runs by phone or in person, cannot start from records, so interviews come first. And if no one can be named as the owner, wait until someone can.
How we run process mapping for agentic AI #
At Vstorm, these steps make up the Strategize stage of TriStorm, our delivery method. The stage produces a map of the workflow and the target operating model, a data and knowledge readiness assessment, and a prioritized implementation plan. The engineers who map the workflow are the engineers who build the system, so the reasons behind the map reach the build intact.
To score candidate workflows with your leadership team in one session, start with our Pragmatics of AI workshop. For the full stage, through to a Proof of Value on your data, see agentic AI consulting.
If you do one thing this week, pick the workflow, name its owner, and export one month of its records. The rest of the map starts there.
Follow the series on our blog
The three articles announced at the start of this guide will appear on the Vstorm blog over the coming weeks, and we will link each one from the steps above as it goes live. To receive them when they are published, subscribe to the Vstorm AI newsletter, which goes out twice a month.