What is LangGraph and how to use it?


Imagine a tool that doesn’t just organize your data but actually understands it—a tool that connects the dots, identifies patterns, and answers your questions in plain language. That’s LangGraph. Whether you’re trying to analyze a social network, uncover hidden fraud, or deliver better recommendations, LangGraph is here to simplify the way you work with data. But what is it exactly, and how does it work?
Introduction to LangGraph
In today’s world, data is everywhere. From social media interactions to business operations, we’re surrounded by complex webs of information. However, making sense of these webs can feel overwhelming. This is where LangGraph comes in. Think of it as your personal data translator, capable of turning tangled datasets into clear, actionable insights.
LangGraph combines the structure of graph databases—which represent data as nodes (entities) and edges (relationships)—with the power of Large Language Models (LLMs) that understand context and meaning. This marriage of technologies unlocks new possibilities, making it easier than ever to see not just the data itself, but the story it’s telling.
How LangGraph works
Let’s break it down. Imagine you’re looking at a massive network of dots and lines. Each dot represents a person, a product, or an idea, while the lines show how they’re connected. At first glance, it’s chaos. LangGraph turns that chaos into clarity by following a structured and intuitive process:
1. Data ingestion
LangGraph begins by importing your data and organizing it into nodes (the dots) and edges (the lines). For instance, in a customer database, each node could represent a customer, while edges signify relationships like referrals or purchases.
2. Semantic enrichment
This is where the magic happens. Using LLMs, LangGraph enriches your data with context and meaning, transforming raw connections into insightful relationships. It’s not just about identifying who’s connected but understanding why they’re connected.
3. Interactive queries
LangGraph makes exploring data as simple as asking questions. Want to identify the most influential customers in your network? Or find out which products are often bought together? Just ask—LangGraph interprets natural language queries and delivers precise answers.
4. Visualization
Finally, LangGraph translates the results into easy-to-understand visuals, like graphs or dashboards, enabling you to see the bigger picture and act confidently.
By blending structure with semantic understanding, LangGraph empowers you to navigate complexity with ease.
Practical applications of LangGraph
LangGraph’s versatility makes it suitable for a wide range of scenarios. Let’s explore how it can help tackle real-world challenges:
Social network analysis
Social networks are intricate, with millions of interactions occurring every second. Technology simplifies these complexities by mapping relationships and identifying key influencers. For instance, marketers can pinpoint the individuals driving conversations and target them for effective campaigns.
Recommendation systems
Imagine you run an e-commerce store. technology can analyze user behavior and product interactions to generate personalized recommendations, helping customers discover products they’ll love while boosting your sales.
Fraud detection
Fraud often hides in subtle patterns. LangGraph brings these patterns to light by visualizing transactional networks and highlighting suspicious behaviors. For example, it can reveal unusual transaction loops between accounts, allowing for timely interventions.
These examples only scratch the surface of what technology can achieve, demonstrating its potential to drive insights across industries.
Step-by-step guide: How to use LangGraph
Navigating LangGraph is designed to be intuitive. Here’s a detailed walkthrough:
Step 1: Define your goal
Start by clarifying what you want to achieve. Are you analyzing customer behavior? Investigating a supply chain? Defining your goal will guide how you structure your data.
Step 2: Prepare your data
Ensure your data is clean and organized. Identify the key entities (nodes) and relationships (edges) relevant to your analysis. For example, in a fraud detection case, nodes could represent accounts, and edges could represent transactions.
Step 3: Integrate your data
Import your prepared data into LangGraph. The tool will structure it into a graph format, automatically creating connections between relevant entities.
Step 4: Enrich and explore
Use LangGraph’s semantic enrichment tools to add context to your data. Then, start exploring by asking natural language questions like, “What are the most frequent connections between these accounts?”
Step 5: Visualize and act
LangGraph presents your findings in an intuitive visual format. Use these insights to take data-driven actions, whether it’s refining marketing strategies or identifying anomalies.
This step-by-step process ensures you can harness the full power of LangGraph without feeling overwhelmed.
Key benefits of using LangGraph
Technology is built to simplify the complex and make data analysis more accessible. Here’s how it can help:
- Flexibility. It adapts to diverse data types and industries, ensuring broad applicability.
- Ease of use. Natural language queries make it approachable for both technical and non-technical users.
- Contextual insights. By adding meaning to raw data, LangGraph helps uncover deeper connections and trends.
- Scalability. Handles datasets of all sizes, from small projects to enterprise-level networks.
Our goal with LangGraph is to empower you to make better decisions by giving you the tools to truly understand your data.
Challenges and Limitations
Every tool has its strengths and weaknesses. Here’s what to consider with LangGraph:
- Data preparation. Clean, structured data is key to getting the best results.
- Learning curve. While intuitive, familiarity with graph theory can enhance your experience.
- Resource demands. Semantic processing can require significant computational resources.
Understanding these limitations can help you use LangGraph effectively and avoid common pitfalls.
What’s next for LangGraph?
LangGraph continues to evolve with advancements in technology. Future updates aim to include real-time data analysis and enhanced natural language capabilities, ensuring it remains a powerful tool for years to come.
Conclusion
LangGraph is designed to help you navigate the complexities of data with confidence. By combining graph theory with natural language processing, it offers a new way to uncover insights and make informed decisions. Whether you’re solving real-world problems or exploring innovative ideas, technology is here to support your journey.
We hope this guide has provided you with a clear understanding of how LangGraph can fit into your work.
You can find us on Clutch
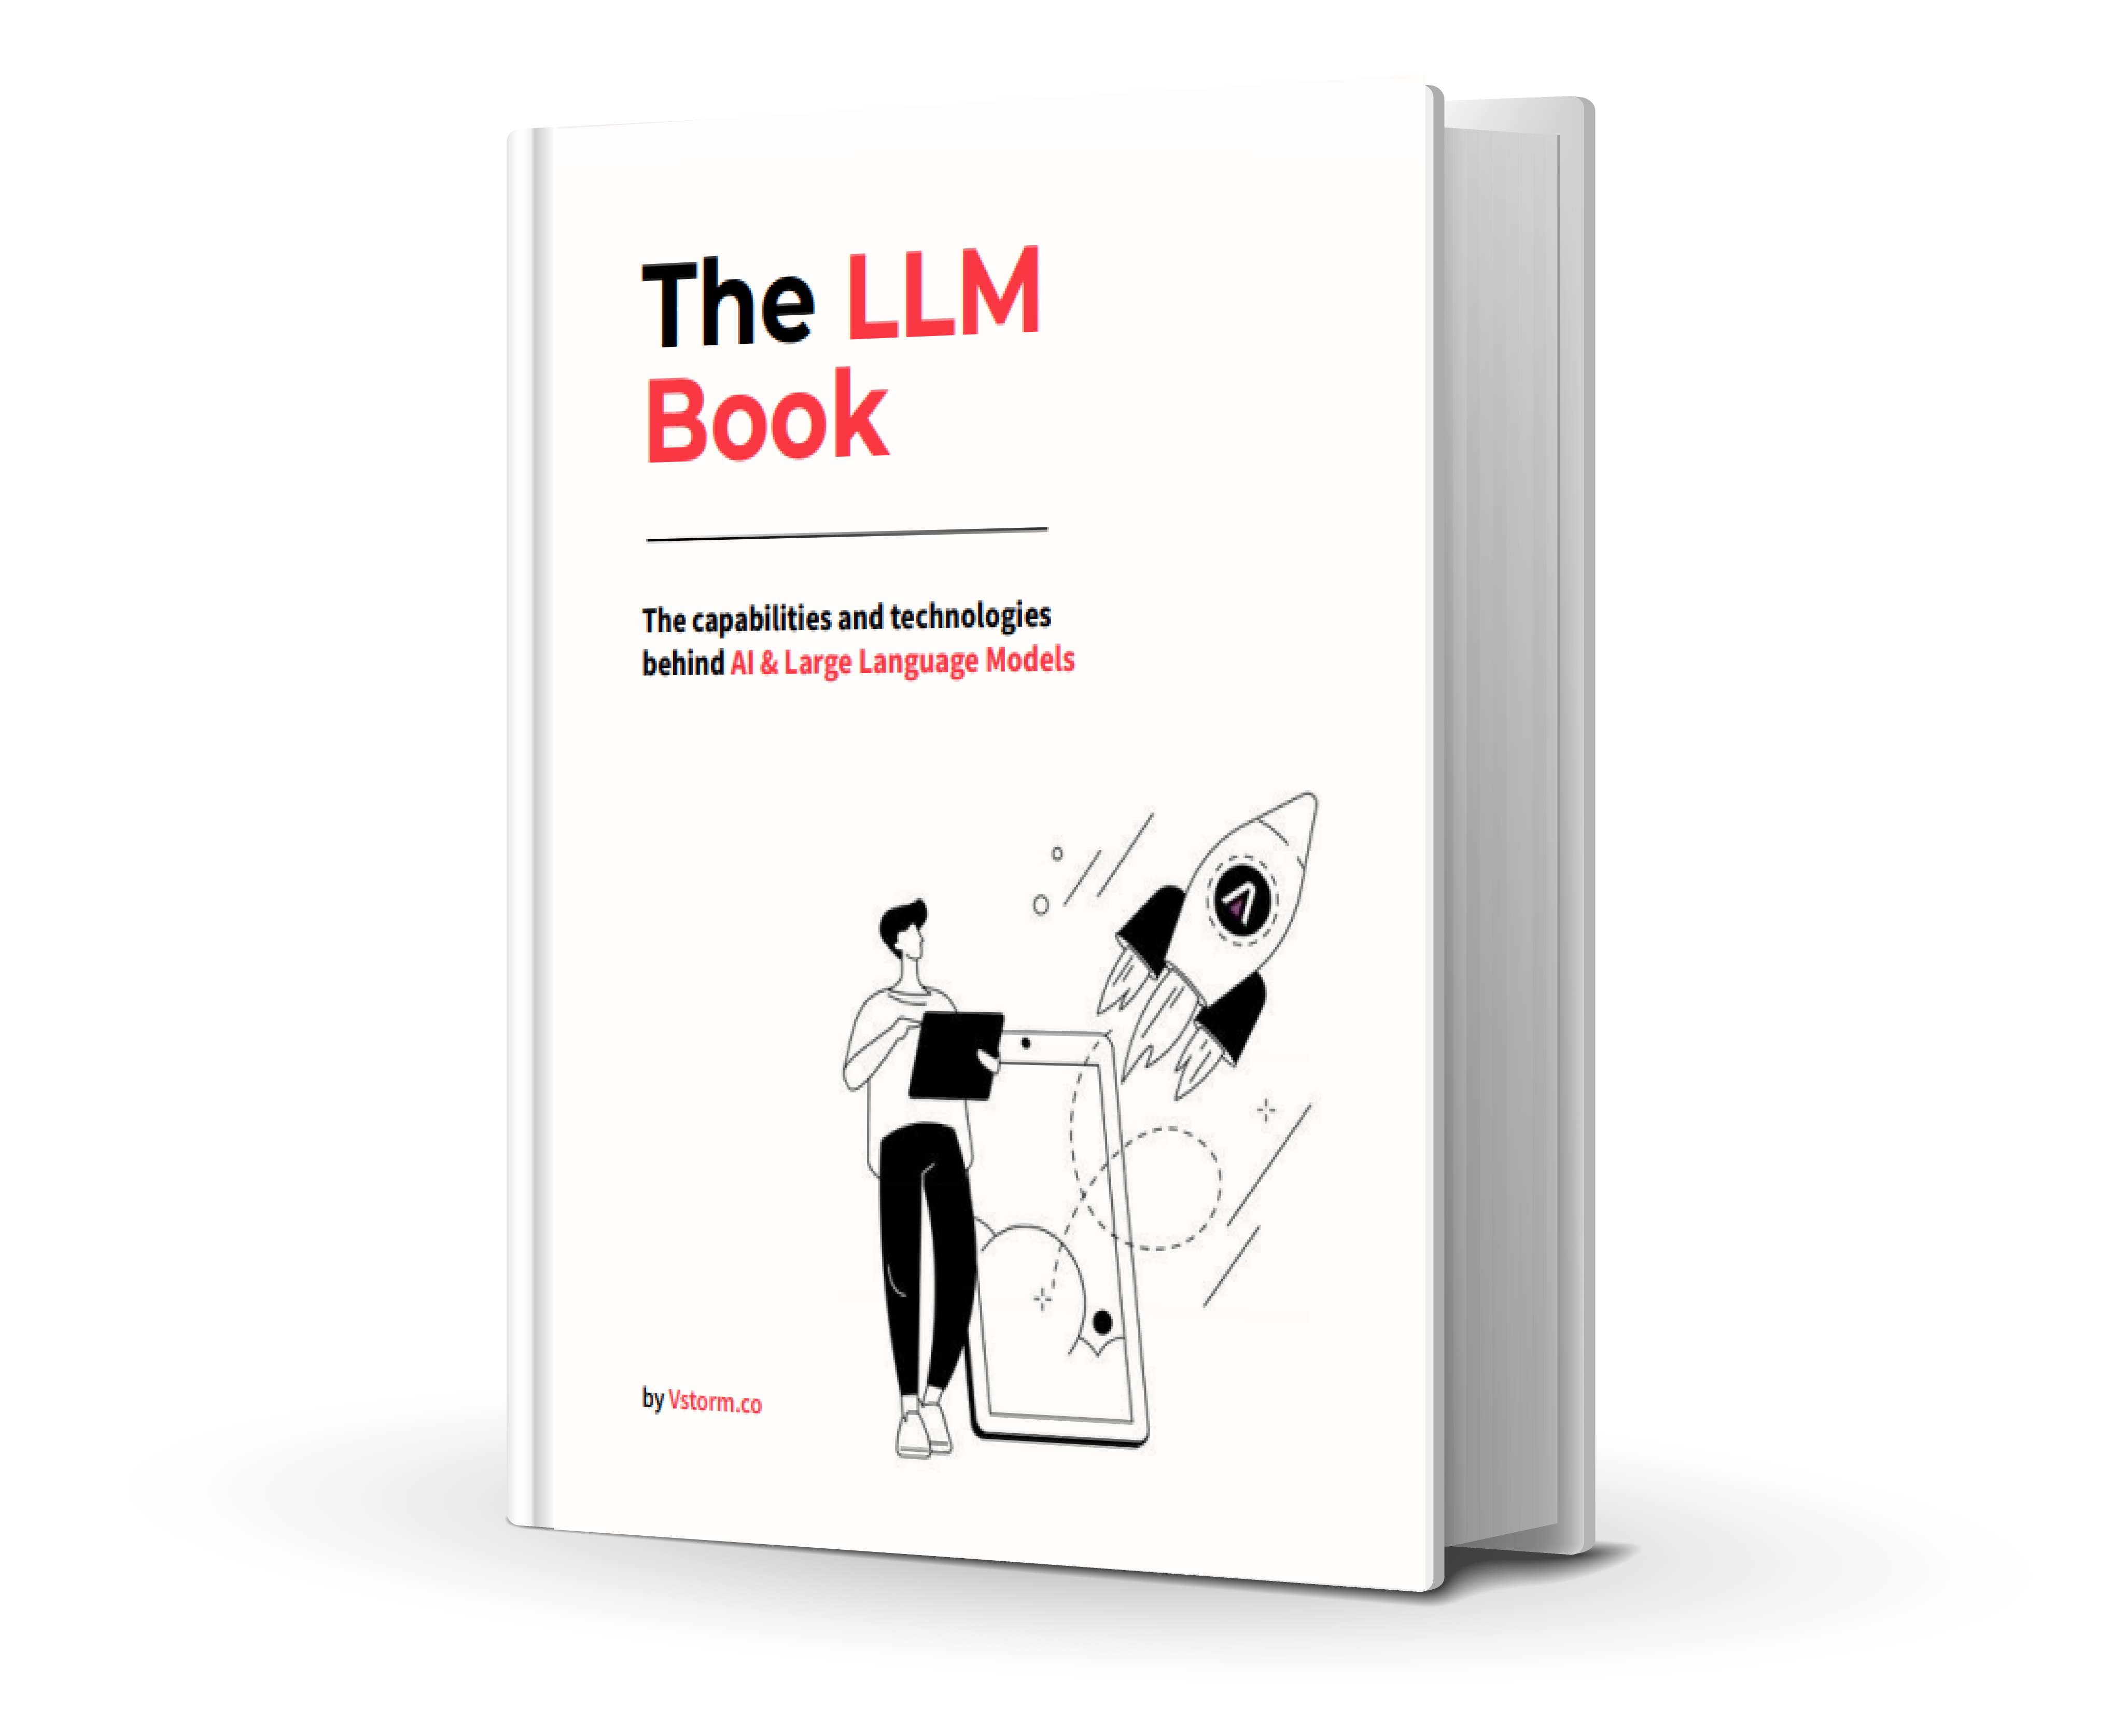
The LLM Book
The LLM Book explores the world of Artificial Intelligence and Large Language Models, examining their capabilities, technology, and adaptation.