One Dashboard, Full Visibility: Why We Use Logfire in Our Stack

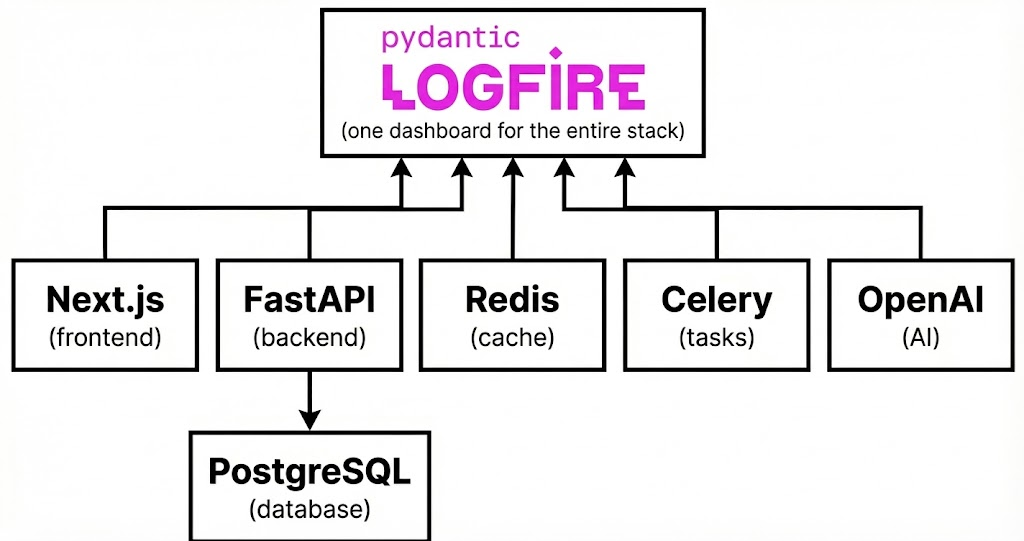
When people ask us about Logfire, they usually think AI agents. Monitoring PydanticAI workflows, tracking token usage, debugging LLM calls. But that is only half the story. At Vstorm, we have been using Logfire for something broader: full-stack observability across our entire application infrastructure.
From Next.js frontend through FastAPI backend, PostgreSQL databases, Redis cache, Celery workers, Stripe payments, all the way to OpenAI API calls. One dashboard. One trace. Complete visibility.
The typical modern stack has a fragmentation problem. You end up with Sentry for errors, Datadog for infrastructure, LangSmith for AI.
Three dashboards, three invoices, zero correlation when you are hunting down a bug at 2 AM. Logfire offers a different approach: unified observability built on OpenTelemetry, designed by the team behind Pydantic, with first-class support for both traditional web applications and AI workloads.
This article shows how we instrument a production application at Vstorm. Not a hypothetical example, but a real system with all the complexity that entails. You will see the exact code we use, the problems it solves, and honest comparisons to the alternatives.
The Problem: blind spots in production applications
Consider a scenario we encounter regularly. A client reports that generating a report takes 30 seconds instead of the expected 5. The questions start flowing:
- Is the problem in the frontend or backend?
- Which database query is slow?
- Is the Stripe API responding slowly?
- Did a Celery task get stuck?
- How many tokens is the AI summary consuming?
Without proper observability, answering these questions requires SSH access, log grep sessions, and a lot of guesswork. The traditional approach involves deploying multiple monitoring tools:

This fragmentation creates real problems:
- Context switching kills debugging speed. When a user reports a slow request, you check Sentry for errors. Nothing obvious. You switch to Datadog to look at database metrics. Something looks off, but the timestamps do not quite align. You open LangSmith to check if AI calls were slow. Now you are correlating timestamps across three dashboards, hoping they are synchronized. By the time you find the issue, an hour has passed.
- Costs compound. Each tool has its own pricing model. Sentry charges per event, Datadog per host plus metrics, LangSmith per trace. For a medium-sized application, you are looking at hundreds of dollars monthly across tools that partially overlap in functionality.
- No distributed tracing across boundaries. This is the killer problem. When a user clicks a button, the request flows through a Next.js SSR, FastAPI endpoint, PostgreSQL query, Redis cache check, Celery task, and an OpenAI API call. With separate tools, each hop is visible in isolation. The connection between them is lost. You cannot see that the slow request started in the browser, hit a cache miss, triggered an expensive database query, and then waited 8 seconds for OpenAI.
Why multiple tools fail at correlation
The fundamental issue is architectural. Sentry was built for error tracking. Datadog was built for infrastructure monitoring. LangSmith was built for LLM observability. Each tool captures its slice of the system beautifully, but none was designed to show the complete picture.
When a user action triggers this flow:
1. Next.js → 2. FastAPI → 3. PostgreSQL → 4. OpenAI → 5. Celery → 6. Redis
You need to see it as one trace. Not six disconnected events in six different tools. The trace ID needs to propagate across every boundary, from browser JavaScript to Python backend to async worker. That is what OpenTelemetry provides, and that is what Logfire implements natively.
The Solution: Logfire as unified observability
What Logfire covers with a single tool:
|
Area |
Traditional Tool |
Logfire |
|
API monitoring |
Sentry/Datadog |
✅ |
|
Database queries |
Datadog |
✅ |
|
Redis/Cache |
Datadog |
✅ |
|
Background tasks |
Datadog |
✅ |
|
LLM calls (OpenAI, Anthropic) |
LangSmith |
✅ |
|
AI Agents (LangChain, PydanticAI) |
LangSmith |
✅ |
|
System metrics |
Datadog |
✅ |
The key differentiator: distributed tracing. One trace shows the complete path of a user request through every layer. When that report generation takes 30 seconds, you open Logfire, find the trace, and immediately see that step 4 (the OpenAI call) took 25 seconds. Problem identified in 30 seconds, not 30 minutes.
Now let us look at how to instrument each layer.
Backend: FastAPI + SQLAlchemy + PostgreSQL
The backend is where most of the business logic lives and so where most performance problems hide.
Basic configuration
The setup is minimal. Three lines instrument your entire FastAPI application:
# app/main.py
import logfire
from fastapi import FastAPI
from sqlalchemy import create_engine

logfire.configure(service_name="my-backend")

app = FastAPI()
engine = create_engine(settings.DATABASE_URL)

# Three lines = full instrumentation
logfire.instrument_fastapi(app)
logfire.instrument_sqlalchemy(engine=engine)
logfire.instrument_httpx() # for external API calls
That is it. No complex configuration, no agent installation, no YAML files to manage.
What you get automatically
With this setup, Logfire captures:
- Every HTTP request: Method, path, status code, duration, response size
- Request arguments: Path parameters, query strings, and request bodies (with Pydantic validation errors highlighted)
- Database queries: Full SQL, execution time, affected rows
- External HTTP calls: URL, method, status, timing for any httpx requests
The Pydantic integration is particularly powerful. When a request fails validation, Logfire shows you exactly which field failed and why. No more parsing validation error JSON to understand what went wrong.
Custom spans for business logic
Automatic instrumentation covers infrastructure, but your business logic needs explicit spans:
@app.post("/projects/{project_id}/reports")
async def generate_report(project_id: int):
    with logfire.span(
	    "Generating report for project {project_id}",
	    project_id=project_id
	  ):
        # Logfire automatically tracks nested operations
        project = await get_project(project_id)   # SQL query → separate span
        usage = await fetch_ai_usage(project)     # HTTP call → separate span

        logfire.info(
	        "Report data collected",
          total_tokens=usage.tokens,
          total_cost=usage.cost
        )

        return await create_report(project, usage)
The `logfire.span()` context manager creates a parent span. Every database query, HTTP call, and nested span within that block becomes a child. The trace shows the hierarchy clearly:
├── POST /projects/123/reports (250ms)
│   ├── Generating report for project 123
│   │   ├── SELECT * FROM projects WHERE id = 123 (15ms)
│   │   ├── GET <https://api.openai.com/usage> (180ms)
│   │   └── Report data collected
│   │       └── total_tokens=15420, total_cost=0.23
Frontend: Next.js with Server-Side Rendering
Frontend observability is often an afterthought. Teams instrument their backend meticulously, then wonder why users complain about slow page loads when server metrics look fine. The problem is usually in SSR, client-side rendering, or the network between them.
Server-Side instrumentation
Next.js supports OpenTelemetry through Vercel’s `@vercel/otel` package:
// instrumentation.ts (Next.js instrumentation file)
import { registerOTel } from '@vercel/otel'

export function register() {
  registerOTel({ serviceName: 'my-frontend' })}
# Environment variables
OTEL_EXPORTER_OTLP_ENDPOINT=https://logfire-api.pydantic.dev
OTEL_EXPORTER_OTLP_HEADERS="Authorization=your-write-token"With this configuration, every Server Component render, Server Action call, and API route becomes a span in Logfire. You see exactly how long SSR takes and which data fetching calls slow it down.
Client-Side instrumentation
For browser-side visibility, Logfire provides a JavaScript SDK:
// components/ClientInstrumentation.tsx
"use client";

import * as logfire from "@pydantic/logfire-browser";
import { useEffect } from "react";

export function ClientInstrumentation() {
  useEffect(() => {
    logfire.configure({
      token: process.env.NEXT_PUBLIC_LOGFIRE_TOKEN,
      serviceName: "my-browser",
    });
  }, []);

  return null;
}
Security note: The browser token should have write-only permissions and rate limiting. Better yet, proxy telemetry through your backend to avoid exposing tokens entirely.
Tracing user interactions
With client instrumentation, you can trace user interactions end-to-end:
async function handleGenerateReport(projectId: number) {
  await logfire.span("User clicked generate report", { projectId }, async () => {
    const response = await fetch(`/api/projects/${projectId}/reports`, {
      method: 'POST'
    });
    return response.json();
  });
}
The trace now starts in the browser and continues through your backend. You see the complete user experience: click, network latency, server processing, database queries, external API calls, response rendering.
Connecting frontend and backend
The magic happens through trace context propagation. When the browser makes a fetch request, OpenTelemetry automatically adds trace headers. The backend extracts these headers and continues the same trace. The result: one trace spanning browser to database.
This is critical for diagnosing UX issues. When users complain about slow page loads, you filter traces by duration, find the slow ones, and see exactly where time was spent. Was it SSR? Database? A third-party API? The trace tells you.
Cache and sessions: Redis
Redis is everywhere in production applications. Session storage, caching, rate limiting, pub/sub. Problems in Redis can cascade across your entire application. A cache miss that should take 5ms suddenly takes 500ms because Redis is overloaded.
Instrumentation
import redis
import logfire

logfire.configure()
logfire.instrument_redis()

client = redis.Redis(host="localhost", port=6379, db=0)

# Every Redis operation becomes a span
client.set("project:123:summary", summary_json, ex=3600)
cached = client.get("project:123:summary")
Each `GET`, `SET`, `HGET`, `LPUSH`, and every other Redis command appears in your traces. You see the key, operation type, and execution time.
Debugging cache issues
Common problems become visible immediately:
- Cache misses: You see `GET project:123:summary` return `None`, followed by an expensive database query. The pattern reveals itself in the trace.
- TTL problems: Keys expiring too quickly or not at all. You can log TTL values and correlate with cache hit rates.
- Connection issues: Slow Redis operations often indicate connection pool exhaustion or network problems. The timing data exposes these issues.
Security consideration
By default, `instrument_redis()` does not capture the values being stored or retrieved. Redis often contains sensitive data: session tokens, user information, cached API responses. If you need value capture for debugging, enable it explicitly and ensure you are not logging sensitive information:
logfire.instrument_redis(capture_statement=True) # Use with cautionPayments: Stripe integration
Payment systems are critical. When payments fail, you need to know why immediately. Was it your code? Stripe’s API? Network latency? A validation error? Every failed payment is a potential lost customer.
Instrumenting Stripe calls
Stripe’s Python SDK uses `httpx` under the hood for async calls and `requests` for sync calls. Instrumenting both covers all Stripe operations:
import logfire
from stripe import StripeClient

logfire.configure()
logfire.instrument_httpx()    # async requests
logfire.instrument_requests() # sync requests

client = StripeClient(api_key=os.getenv('STRIPE_SECRET_KEY'))
Every Stripe API call now appears in your traces. You see the endpoint, response time, and status code.
Adding business context
Raw HTTP calls to Stripe are useful, but business context makes them actionable:
async def create_subscription(customer_id: str, plan_id: str):
    with logfire.span("Creating subscription", customer_id=customer_id, plan_id=plan_id):
        try:
            subscription = await client.subscriptions.create_async(
                customer=customer_id,
                items=[{"price": plan_id}]
            )

            logfire.info("Subscription created",
                        subscription_id=subscription.id,
                        status=subscription.status
            )

            return subscription

        except stripe.StripeError as e:
            logfire.error("Subscription creation failed",
                         error_type=type(e).__name__,
                         error_message=str(e)
            )
            raise
Background tasks: Celery
Long-running operations belong in background workers. Report generation, email sending, data processing. Celery is the standard choice for Python applications, but debugging Celery tasks has traditionally been painful. Logs scattered across worker processes, no connection to the HTTP request that triggered the task. A user clicks a button and… then what?
Worker instrumentation
# tasks.py
import logfire
from celery import Celery
from celery.signals import worker_init

@worker_init.connect()
def init_worker(*args, **kwargs):
    logfire.configure(service_name="my-worker")
    logfire.instrument_celery()

app = Celery("myapp", broker="redis://localhost:6379/0")

@app.task
def generate_report(project_id: int, user_id: int):
    with logfire.span(
	    "Generating report", project_id=project_id, user_id=user_id
	  ):
        data = fetch_project_data(project_id)
        pdf = create_pdf_report(data)
        upload_to_storage(pdf)
        notify_user(user_id, pdf.url)
The `worker_init` signal ensures each Celery worker initializes Logfire when it starts. Every task execution becomes a trace.
Beat scheduler
For scheduled tasks, instrument the Beat scheduler separately:
from celery.signals import beat_init
from celery.signals import beat_init

@beat_init.connect()
def init_beat(*args, **kwargs):
    logfire.configure(service_name="my-beat")
    logfire.instrument_celery()
Distributed tracing across task boundaries
Here is where it gets interesting. Trace context propagates from HTTP request to Celery task. When a user clicks “Generate Report,” the trace shows:
├── POST /projects/123/reports (150ms)
│   ├── SELECT * FROM projects WHERE id = 123 (12ms)
│   ├── Task enqueued: generate_report (8ms)
│   │
│   └── [async continuation in worker]
│       ├── generate_report task (45000ms)
│       │   ├── Fetch project data (200ms)
│       │   ├── Create PDF report (30000ms)
│       │   ├── Upload to storage (14000ms)
│       │   └── Notify user (800ms)
One trace, complete visibility, from button click to email notification. No more wondering what happened after the task was enqueued.
Debugging long-running tasks
When a Celery task takes longer than expected, the trace reveals why. Is it the database query? File generation? External API? You see the time spent in each operation and can identify the bottleneck immediately.
System metrics: infrastructure monitoring
Application traces show what your code is doing. System metrics show what your infrastructure is doing. Both matter for production debugging.
Basic setup
import logfire

logfire.configure()
logfire.instrument_system_metrics()
This single line enables the collection of system metrics. Logfire provides a pre-built dashboard showing:
- process.cpu.utilization: CPU usage by your application process
- system.memory.utilization: Available system memory
- system.swap.utilization: Swap usage (often indicates memory pressure)
- system.disk.io: Disk read/write operations
When system metrics matter
System metrics become critical in specific scenarios:
- Memory leaks in long-running workers: Celery workers that slowly consume more memory over time. The gradual increase is visible in metrics long before the worker crashes.
- CPU spikes during report generation: PDF generation is CPU-intensive. Metrics show whether CPU is the bottleneck or if you have headroom.
- Disk I/O for file operations: Processing large files can saturate disk I/O. Metrics reveal whether you need faster storage or better file handling patterns.
The power comes from correlation. A slow trace combined with high CPU metrics tells a different story than a slow trace with low CPU. The first suggests a computational bottleneck; the second suggests I/O wait or external API latency.
AI integration: PydanticAI
AI features are increasingly common in production applications, such as content generation, data analysis, chatbots, automated summaries. These features share a challenge: LLM calls are slow, expensive, and unpredictable. Without observability, you are flying blind.
Instrumenting PydanticAI
import logfire
from pydantic_ai import Agent

logfire.configure()
logfire.instrument_pydantic_ai()

summarizer = Agent(
    'openai:gpt-4o',
    system_prompt="You are a helpful assistant that summarizes project data."
)

@app.post("/projects/{project_id}/summary")
async def generate_summary(project_id: int):
    with logfire.span(
	    "AI summary for project {project_id}", project_id=project_id
	  ):
        project = await get_project(project_id)  # SQL → span

        result = await summarizer.run(
            f"Summarize this project: {project.description}"
        )

        logfire.info("AI summary completed",
                     input_tokens=result.usage().request_tokens,
                     output_tokens=result.usage().response_tokens,
                     model=result.model_name()
        )

        return {"summary": result.data}
What Logfire captures for AI calls
The PydanticAI instrumentation provides detailed visibility:
- Model and provider: Which model handled the request
- Token usage: Input tokens, output tokens, total tokens
- Latency: Time to first token, total generation time
- Tool calls: If the agent uses tools, each tool call is a child span
- Retries: If the agent retries due to validation errors, each attempt is visible
Comparison with LangSmith
LangSmith is purpose-built for LLM observability and excels at it. The trace visualization for complex agent workflows is excellent. However, LangSmith only sees AI operations. It does not know about your database queries, HTTP endpoints, or background tasks.
Logfire provides unified visibility. The AI call is just another span in a trace that includes everything else. When an AI-powered feature is slow, you see the complete picture: database query to fetch context (500ms), AI call (3000ms), post-processing (200ms). With LangSmith alone, you would only see the 3000ms.
For teams already using Pydantic and PydanticAI, the integration is seamless. Same configuration, same dashboard, same query language.
Everything together: debugging in practice
Let us walk through a real debugging scenario to see how unified observability changes the workflow.
The scenario
Monday morning. A customer support ticket lands in Slack: “Generating the monthly report for Project X takes 30 seconds. It used to take 5 seconds.”
With fragmented tooling, this would mean opening three dashboards, correlating timestamps, and hoping the clocks are synchronized. With Logfire, it takes five minutes.
Step 1: find the trace
Open Logfire dashboard. Filter by:
Service: my-backend
Path: /projects/*/reports
Duration: > 10s
Time range: Last 24 hours
You find several slow traces. Click into one for Project X.
Step 2: analyze the trace
The trace tells a story:
├── POST /projects/456/reports (32,450ms)
│   ├── Generating report for project 456
│   │   ├── SELECT * FROM projects WHERE id = 456 (12ms)
│   │   ├── SELECT * FROM usage_records WHERE project_id = 456 (18,234ms) ⚠️
│   │   ├── GET <https://api.openai.com/v1/chat/completions> (8,120ms)
│   │   ├── Redis GET project:456:summary (2ms) [MISS]
│   │   ├── Task enqueued: generate_pdf (15ms)
│   │   └── Report data collected
│   │       └── total_tokens=12450, total_cost=0.19
The problem jumps out: the `usage_records` query takes 18 seconds. Everything else is reasonable.
Step 3: root cause analysis
Click into the slow query span. Logfire shows the full SQL:
SELECT * FROM usage_records WHERE project_id = 456
Check the `usage_records` table. Project 456 has 2 million records and it is the customer’s oldest and largest project. The query lacks pagination and is fetching all records into memory.
Additionally, you notice the Redis cache miss. The summary could have been cached but was not, triggering an unnecessary 8-second OpenAI call.
Step 4: implement fixes
Two changes:
1. Add pagination to the usage records query, only fetch what is needed for the report
2. Increase Redis cache TTL for project summaries from 1 hour to 24 hours
Step 5: verify the fix
Deploy the changes. Watch new traces for Project X reports:
├── POST /projects/456/reports (2,340ms)
│   ├── Generating report for project 456
│   │   ├── SELECT * FROM projects WHERE id = 456 (12ms)
│   │   ├── SELECT * FROM usage_records WHERE project_id = 456 LIMIT 1000 (45ms) ✓
│   │   ├── Redis GET project:456:summary (3ms) [HIT] ✓
│   │   ├── Task enqueued: generate_pdf (12ms)
│   │   └── Report data collected
Report generation now takes 2.3 seconds. Problem solved. Customer notified before lunch.
Step 6: set up alerts
Configure a Logfire alert: if any `/projects/*/reports` request takes longer than 10 seconds, send a Slack notification. If the problem returns, you will know immediately.
Logfire vs. the alternatives
An honest comparison helps you make the right choice for your stack.
Logfire vs. Sentry
Sentry strengths:
- Mature error tracking with excellent stack traces
- Great issue grouping and deduplication
- Strong mobile SDK support
- Session replay for frontend debugging
Logfire strengths:
- Full distributed tracing, not just error events
- Database query visibility
- AI/LLM native support
- Unified backend + frontend + AI in one trace
Verdict: Sentry excels at error tracking. Logfire excels at understanding why errors happen through distributed tracing. For Python-heavy stacks with AI features, Logfire provides more actionable insights.
Logfire vs. Datadog
Datadog strengths:
- Massive scale and enterprise features
- Extensive infrastructure monitoring
- APM for many languages
- Log management and SIEM capabilities
Logfire strengths:
- Simpler pricing model
- Python-native with Pydantic integration
- AI observability built-in
- Faster setup, less configuration
Verdict: Datadog is the enterprise choice for multi-language, multi-cloud environments. Logfire is the better choice for Python-focused teams who want full visibility without enterprise complexity.
Logfire vs. LangSmith
LangSmith strengths:
- Purpose-built for LLM debugging
- Excellent visualization for agent workflows
- Dataset and evaluation tools
- Prompt management features
Logfire strengths:
- AI observability plus everything else
- One trace from browser to LLM to database
- No separate tool for non-AI observability
Verdict: LangSmith is superior for pure LLM debugging and prompt engineering workflows. Logfire wins when AI is one part of a larger application and you want unified observability.
Who should use Logfire
Logfire makes the most sense for:
- Teams already using Pydantic/FastAPI: The integration is seamless, the mental model aligns
- Applications combining traditional web with AI: One dashboard for everything
- Teams tired of juggling multiple observability tools: Consolidation reduces cognitive load and cost
- Projects where debugging speed matters: Distributed tracing finds problems fast
Logfire may not be the best choice for:
- Non-Python backends: While OpenTelemetry supports all languages, Logfire’s Python integrations are where it shines
- Pure LLM applications without web components: LangSmith’s specialized features may prove more valuable
- Enterprises requiring specific compliance certifications: Check Logfire’s current compliance status for your requirements
Getting started: the Full-Stack template
Setting up all these integrations from scratch takes time. FastAPI configuration, database connections, Redis setup, Celery workers, frontend authentication, Logfire instrumentation. Each piece is straightforward individually, but getting everything working together requires careful orchestration.
To solve this, we built and open-sourced our [full-stack-fastapi-nextjs-llm-template, a production-ready project generator that includes Logfire integration out of the box.
What the template provides
The generator creates a complete project with 20+ configurable integrations:
# Install the generator
pip install fastapi-fullstack

# Create a new project with AI agent preset
fastapi-fullstack create my_app --preset ai-agent
The generated project includes:
FastAPI backend with async PostgreSQL, Redis, and Celery
Next.js 15 frontend with React 19 and TypeScript
PydanticAI or LangChain agent with WebSocket streaming
Logfire instrumentation for the entire stack
Authentication with JWT, refresh tokens, and optional OAuth
Admin panel with SQLAdmin
Docker configuration for local development and production
The template handles the boilerplate so you can focus on building features. Every component described in this article, from FastAPI endpoints to Celery workers to AI agents, comes pre-configured with observability.
Quick start
# Create project
fastapi-fullstack create my_app --preset ai-agent

# Start development
cd my_app
make install
make docker-db
make db-migrate
make db-upgrade
make run

# In another terminal
cd frontend && bun install && bun dev
Within minutes, you have a running application with full Logfire observability. The [GitHub repository](https://github.com/vstorm-co/full-stack-fastapi-nextjs-llm-template) includes detailed documentation for customization and deployment.
Conclusion
The observability landscape for modern applications has been fragmented for too long. One tool for errors, another for infrastructure, a third for AI. Each tool solves its problem well, but the gaps between them cost engineering time when debugging production issues.
Logfire offers a different approach. Built on OpenTelemetry standards, designed by the Pydantic team, it provides unified observability across your entire stack. FastAPI endpoints, PostgreSQL queries, Redis operations, Celery tasks, Stripe payments, OpenAI calls. One trace shows the complete story.
For Vstorm, the migration to Logfire simplified our debugging workflow significantly. Instead of correlating timestamps across dashboards, we follow a single trace. Instead of managing multiple vendor relationships, we have one. The time saved during incidents pays for itself.
The setup is minimal. A few `instrument_*()` calls and you have production-grade observability. The traces are detailed. The dashboard is fast. The pricing is straightforward.
If you are building Python applications with Pydantic, FastAPI, or PydanticAI, Logfire deserves serious consideration. And if you want to skip the setup entirely, our full-stack template gets you there in minutes.
Summirize with AI
The LLM Book
The LLM Book explores the world of Artificial Intelligence and Large Language Models, examining their capabilities, technology, and adaptation.


